Businesses nowadays are battling with the challenge of generating and storing vast amounts of data.
Data is meaningless without an efficient method to process and analyse and results produced. Business intelligence is key to gaining insights from datasets and representing this is in a way which is useful to users.
System C has a wide range of technical expertise and experience relevant to business intelligence. Our team also includes Microsoft Power BI certified professionals with extensive knowledge and experience. You can read more about our experience with data visualisation in the case studies featured on this page.

Find Out More
If you are interested in speaking to a member of our team about how we can help your business, then please get in touch via our contact form.
Get in Touch

Case Study: ContrOCC Insights
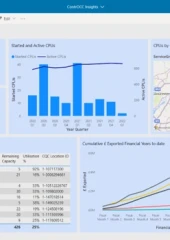
Our social care product ContrOCC Insights is built on Microsoft Power BI which enables a huge variety of report styles ranging from simple lists to maps and dashboards. It offers a high level of interaction with reports, automated distribution, simple sharing of reports between colleagues, built in analytics and strong, flexible security.
Read More

Case Study: Energy Systems Catapult
We were commissioned by Energy Systems Catapult to identify and develop a solution to improve how the results from their Home Energy Dynamics (HED) toolkit are displayed.
Read More

Case Study: Poseidon
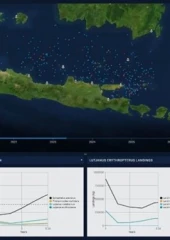
Our work with Poseidon involved visualising results from large geospatial datasets and producing extremely complex dashboard-based visualisations. This project involved extending the user interface to include new chart types and new methods of data visualisation. Our work on this project also involved us designing a new data structure for the model, to better enable visualisation of outputs.
Read More

Case Study: Oxfordshire Mobility Model
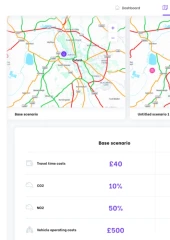
We are leading a consortium of five SMEs and a local authority to build a strategic transport modelling system using agent-based modelling to predict the flow of traffic over predicted and proposed real-world roads and junctions in Oxfordshire.
Read More


