You are here:
- Home
- >
- Knowledge Hub
- >
- Case Studies
- >
- Enabling Companies to Efficiently Visualise Their Data with Power BI.
Over the past 70 years there has been an explosion in the amount of data generated and stored by businesses. Tackling this avalanche of intelligence has not come without challenges. More information is available than ever before, but for users to derive value from that data, it must be made accessible. The importance of business intelligence systems which can translate that data into insights, reports, and interactive visualisations cannot be underestimated.
OCC has helped many organisations to tackle these challenges. As a leading provider of social care finance software to local government, we understand the importance of extracting and utilising key data sets.
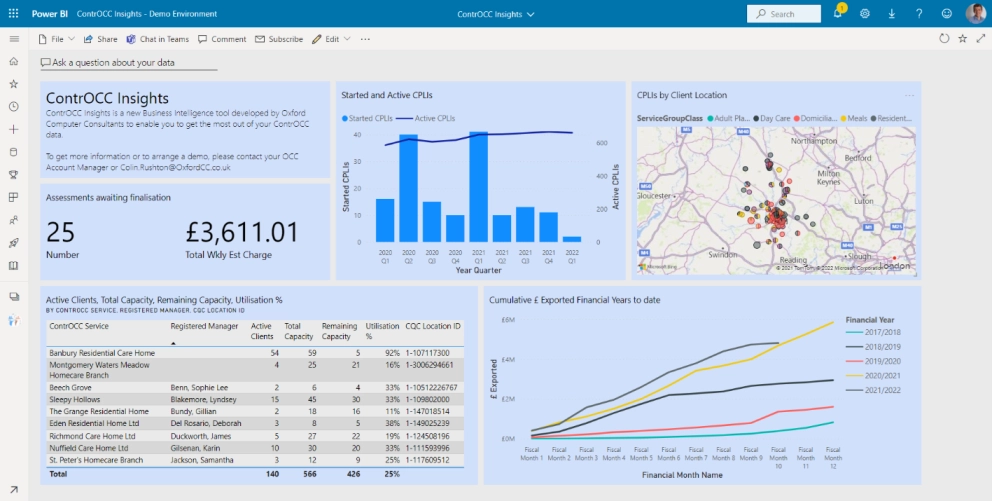
Our social care product ‘ContrOCC Insights’ is built in Power BI and allows councils to pull the information they need and display it in a meaningful way.
OCC was commissioned by Energy Systems Catapult to identify and develop a solution to improve how the results from their Home Energy Dynamics (HED) toolkit are displayed. The HED toolkit is a detailed dynamic domestic modelling simulation toolkit used for identifying pathways to decarbonising dwellings. Results from the tool have informed a range of clients including the Department for Energy Security and Net Zero (formerly BEIS), Nesta and the Scottish Government.
The Catapult required a new, efficient way of visualising and interpreting energy usage system data around the home. The goal was to replace a manual in-house data reporting system which involved maintaining spreadsheets.
In terms of the benefits of this new approach, converting their spreadsheets to a dynamic dashboard:
This will be more interactive and engaging for internal Catapult stakeholders.
OCC developed a data warehouse and worked with the Catapult to create an HED Dashboard in Power BI which would automatically refresh from a range of datasets in the warehouse.
A range of different house types and heating model types were configured, the latter included:
Data Analysis Expressions (DAX) were created to filter the data and display the custom energy metrics Energy Systems Catapult required such as:
OCC analysed the Catapult’s data and consulted with their Data Analysts to ensure that the solution could be scaled to manage future data efficiently. The dashboard parameters were set up to be modifiable if their reporting requirements changed.
As well as streamlining the Energy System Catapult Modelling Team’s reporting and analysis processes, the solution is not overly reliant on coding, making it accessible to users with limited technical knowledge. To ensure users can use the dashboard effectively, OCC provided training sessions to the Catapult’s end-users.
The Catapult plans to continue enhancing the dashboard, populating it with more data as they expand the HED library of house archetypes and occupancy profiles, and to potentially publish it externally.